atop_
Real-time Apache Traffic Monitoring
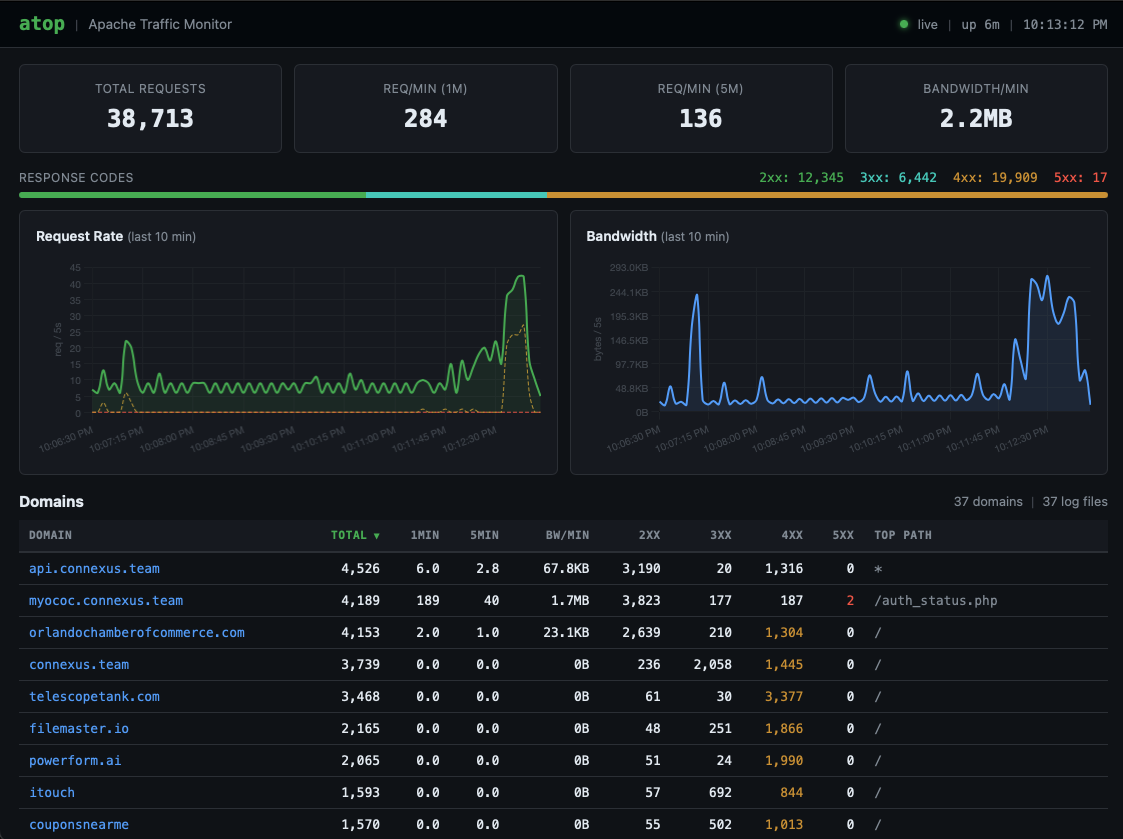
Monitor your Apache web server traffic in real time. See live requests, response codes, bandwidth usage, top URLs, and top IPs across all your virtual hosts — from your terminal or browser.
atop - Apache Traffic Monitor 14:32:07 up 42 days
Watching: /var/log/apache2/ (12 log files, 8 domains)
Total: 48,210 requests 1min: 142 req/min 5min: 128 req/min BW: 3.8 MB/min
STATUS 2xx: 41230 3xx: 2840 4xx: 3620 5xx: 520
DOMAIN TOTAL 1min 5min BW/min 2xx 3xx 4xx 5xx TOP PATH
api.connexus.team 8420 42 38 1.2MB 7800 120 480 20 /v1/events
orlandochamberofcommerce.com 6200 18 22 800KB 5900 80 200 20 /
connexus.team 5100 15 12 640KB 4800 50 230 20 /dashboard
codeneo.dev 4300 12 10 520KB 4100 30 150 20 /projects
swamplilly.com 3800 10 9 380KB 3600 20 160 20 /gallery
theclearwatertimes.com 2100 8 7 240KB 1900 40 140 20 /news
[q]uit [s]ort [r]everse [p]ause [d]etail [1-9] refresh interval